In the blog of November 2016, we wrote about the newly introduced Cloud BI Tool of SAP; SAP Analytics cloud (the successor of SAP BusinessObjects Cloud). The visual possibilities, the different ways to access data and the location of the tool within the SAP-landscape were described in that blog.
The added value of SAP Analytics Cloud
To give you a better view of the added value of SAP Analytics Cloud, this blog will give you a couple of specific examples of the possibilities within Analytics Cloud. The given examples are based on a management meeting within a fictive organization.
SAP Digital Boardroom
The Digital Boardroom within Analytics Cloud, is built to make your management meeting as efficient as possible. The different agenda-items of the management meeting can be divided per presenter. Every presenter has the possibility to add multiple sub-items to his/her agenda-item (see figure 1).
By sharing the presentation screen, people can join the presentation remotely.

Figure 1. SAP Digital Boardroom
Every agenda-item contains three screens within SAP Analytics Cloud. These screens can be presented one by one or all at the same time using multiple monitors. Every agenda-item consists of:
- The overview screen: this screen is built to give a short summary of the agenda-item;
- The content screen: this screen is used to present the elaboration of the most important discussion;
- The context screen: this screen provides the attendees of the meeting with the details of the content screen. An example of a context screen, of, in this case, the second sub-item of the management meeting, is shown in figure 2
By using these three different screens, the attendees of the management meeting will be given an impression of the situation at the beginning (using the overview screen) before the presenter will start the actual analysis and discussion (using the content- and context screen).
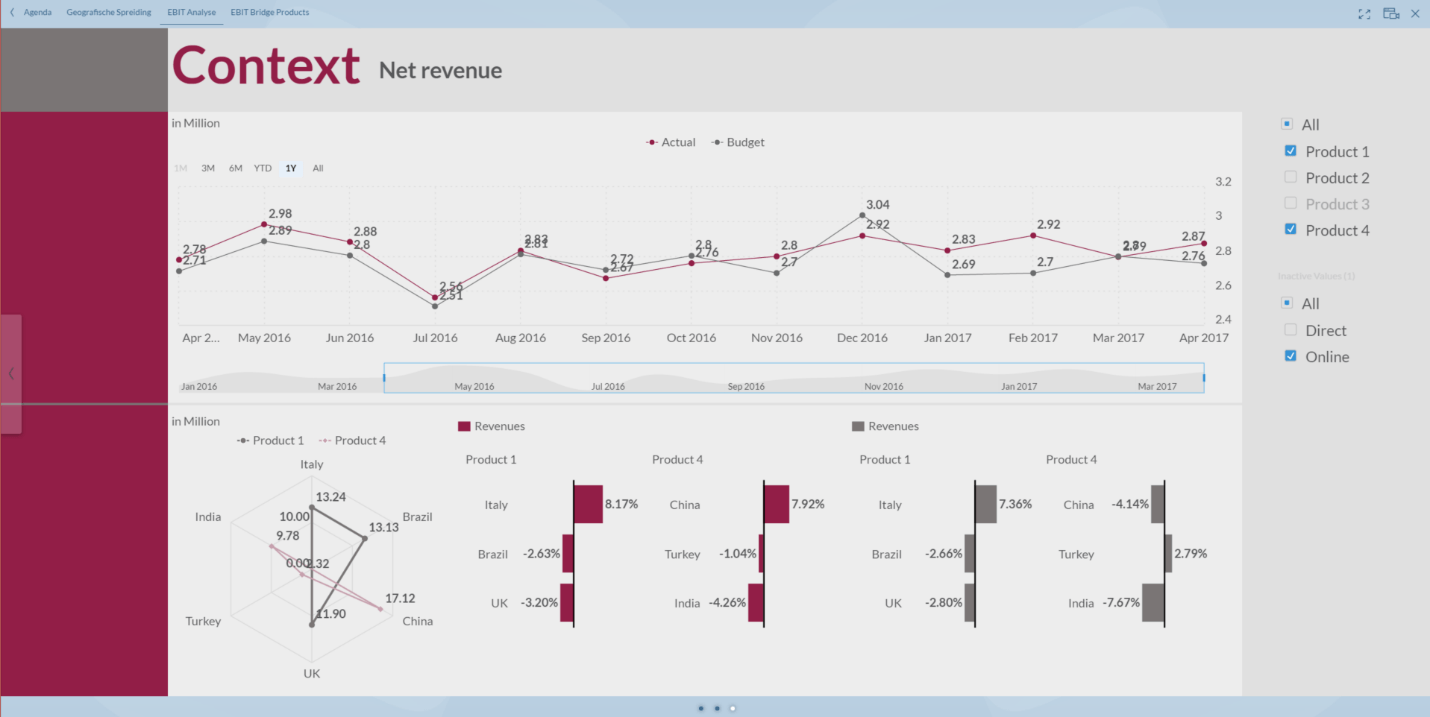
Figure 2. Example of a context screen
The four bar charts in figure 2 show a nice feature of SAP Analytics Cloud; the use of calculated measures. Within the tool it is possible to use a variety of calculations and show the results in charts and tables. The example above contains a simple calculation, showing the revenue-difference, in percentages, between the current and previous year.
Visualization
The agenda-item in figure 2 is linked to a ‘story’ within Analytics Cloud. Within these ‘stories’, there are lots of possibilities to visualize and filter data. There are more than 20 different visualization possibilities. It is possible, for example, to add graphs, tables, pictures, shapes and ‘value driver trees’ to your dashboards.
A summary of a couple of visualization possibilities is shown in the movie below.
Easy communication with your colleagues
Within Analytics Cloud, communicating with your colleagues is easy. Communicating in the tool is done by adding comments to visualizations, reply on the comments of your colleagues and by liking their comments (see figure 3).
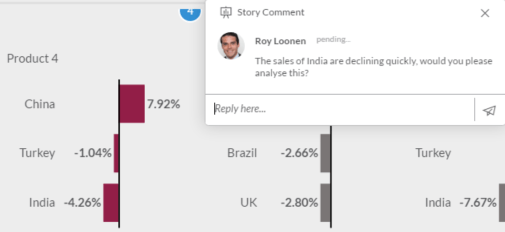
Figure 3. Comments
Agenda functionalities
SAP Analytics Cloud also has the possibility to create an agenda. Within this agenda it is possible to add different business processes. These business processes can be divided into multiple ‘events’.

Figure 4. Events
After dividing the business process into multiple events, the different tasks can be assigned to users. The assigned users will be informed by mail and, if needed, reminders will be sent a couple of days before the task needs to be finished. To review the different tasks, it is possible to add ‘reviewers’ and ‘final reviewers’ to every task.
The video below shows a summary of the different functionalities within such an agenda.
Benefits
Summarizing we can point out the following benefits of SAP Analytics Cloud:
- User friendly character;
- Link to SAP BPC; your data and your own recognizable dimensions directly from your current SAP-environment;
- Get quick insights in your data using multiple visualizations;
- Creating these visualizations is easy using the recognizable dimensions;
- Always and everywhere access to SAP Analytics Cloud on every device; with up-to-date data in the cloud.