Analyze without compromise
Today, companies need the finance organization to be more than just the recordkeeping accounting function. They rely more heavily upon the CFO and finance organization as a strategic partner to the business, by providing business insight and predictions to support decision-making and impact the strategic direction. Finance leaders deal with these challenges by becoming more forward-looking and moving more and more towards the adoption of (predictive) analytics, data science and other innovative technologies. These technologies allow them to create meaningful forward-looking insights, combining both operational and financial information to support more informed decision-making.
OneStream’s BI/Analytics Strategy fits this need perfectly, by enabling finance and business users to quickly integrate, analyze, visualize, and draw insights across all aspects of their business within a single, unified platform. Their strategy is to provide easy access to all the data these users need for analysis, directly within OneStream so they can “analyze without compromise.”
OneStream’s latest platform release, OneStream XF 5.2, enables organizations to integrate a broad range of data types, from summarized financial data to detailed operational data in a single platform. New BI Dashboards and Pivot Grids enable self-service data visualization to highlight and analyze key business trends.
In short, the following features were added to OneStream’s Fall release:
- BI Blend
- Self-Service Dashboards
- Pivot Grids
- Performance on Large data Volumes
BI Blend
With the BI Blend feature, OneStream enables the blending detailed operational data with cube dimensions. It transforms and aggregates all data into a unified reporting format by using the metadata and hierarchies from the cube. The data is stored in separate tables, from which it can be reported using cube views, dashboards and Pivot Grids (discussed later in this blog). The blended data is read-only, meaning that no calculations or business rules can be utilized. However, it is possible to translate the data into a single target currency.
The BI Blend feature applies an in-memory process to collect, transform and aggregate the information. Once that process is finalized, the data is stored in relational column-store tables. During this process, also the parent records are stored in the table, allowing for greater performance.
The BI Blend feature is especially useful when you want to aggregate and report operational information based on hierarchies in OneStream, but do not want to put all that information into your financial model supporting the concept of “leave the data where it belongs”. BI Blend enables a governed process, while keeping your planning models agile.
Self-Service Dashboards
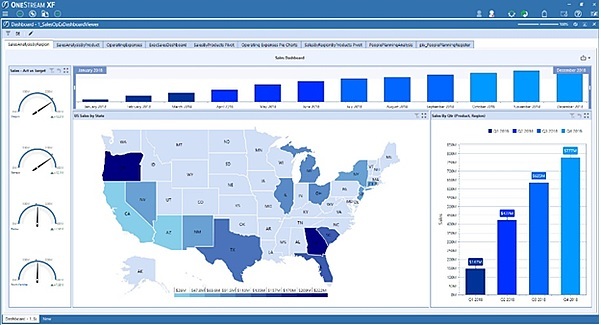
Within this new release, it becomes much easier to create highly visual dashboards. In prior releases, creating a dashboard required setting up many elements and linking them together. In version XF 5.2, the BI Viewer component is introduced allowing you to easily create a dashboard by dragging and dropping different items to view your data. In addition to the basic chart types, you can also use gauges, range filters, grids, maps and many more.
All elements are interactive and by means of drilling down into a certain item, all other items on your dashboard are adjusted as well. By means of using the color schemes in a smart way, you can also view a certain department, product or entity in the same color across all visualizations.
OneStream XF 5.2 enables users to quickly configure interactive dashboards that grant users real-time access to trusted data in OneStream, and other data sources. With this enhanced dashboard building component, OneStream allows customers to reduce the need to export data out to third party BI tools such as Power BI and Tableau to leverage advanced visualizations.
Pivot Grids
Besides the new BI Viewer component, another dashboard component has been released, called the Pivot Grid Dashboard Component. This offers fast ad hoc data exploration of large volumes of data, by creating a pivot table. Data from any source can be used to perform multi-dimensional analysis. Conditional formatting can be used to quickly identify and highlight important information, just by a click of the mouse. Additional key features include the ability to add calculated fields, like text and measures, sort, filters, automatic totals and many more.
Performance on Large Data Volumes
OneStream XF 5.2 includes some enhancements to improve performance in reporting and analysis on larger data sets, such as paging and sparse data suppression. In 2020 and 2021 OneStream will deliver additional capabilities as part of the X-Scale initiative, including scheduled and autonomous scaling of MS Azure cloud resources.
How can your organization benefit?
With the XF 5.2 release, the OneStream platform is extended with self-service dashboards and built-in governed analytics. Instead of moving your data to a BI platform, OneStream has brought the BI capabilities into OneStream. You can bring in all information you need into OneStream and analyze it within a single platform. This way, you retain all the financial intelligence, governance, workflow and the single version of the truth for financial and operational data that you need for reporting, analysis and decision-making.
With these new features, you can:
- Simplify IT landscape – utilize one platform for CPM, BI, Analytics and Visualization across all parts of the organization. This allows you to eliminate fragmented tools and reduce the total cost of ownership.
- Integrate financial and operational data – rapid collecting, mapping and loading of large data volumes from external sources.
- Eliminate latency and replication – no need for moving data into separate BI tools, causing latency and loss of control.
- Increase speed of value – self-service dashboards allow finance and business users to analyze financial results or operational data super-fast. All can be done using familiar workflows, controls and analysis tools.
- Complete transparency – the OneStream platform provides complete transparency and audit trails for all data within the platform; financial, planning or operational data.


